snippet.sun_spectrum
Plot the sun spctum at the Earth orbit.
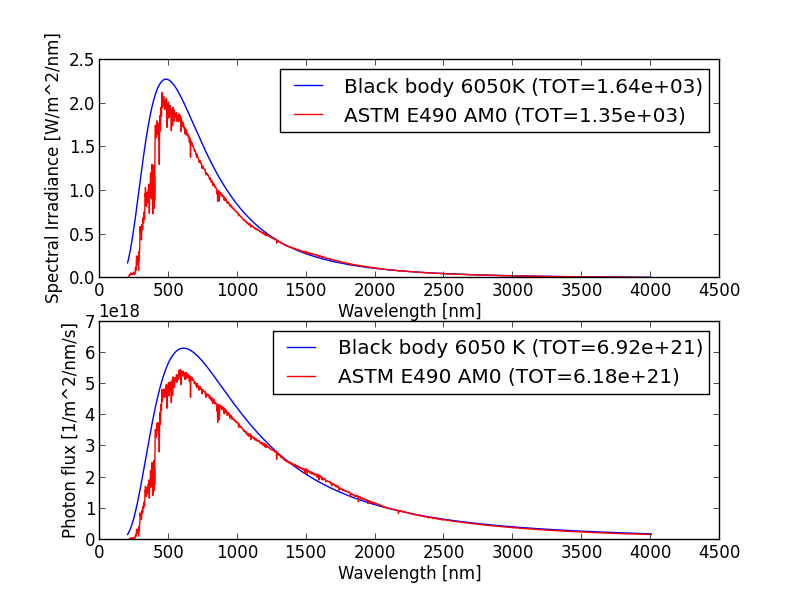
An useful website http://www.powerfromthesun.net/Book/chapter02/chapter02.html
'''Plot the sun spctum at the Earth orbit.

.. image:: ../../../src/scripts/snippet/sun_spectrum.png

An useful website
http://www.powerfromthesun.net/Book/chapter02/chapter02.html

'''
import numpy as np
import matplotlib.pyplot as plt
import irfpy.util.solarspectra

def main():
    '''Main script'''
    wavelength = np.linspace(200, 4000, 3801) * 1e-9
    dwl = wavelength[1] - wavelength[0]

    ### Black body
    bb = irfpy.util.solarspectra.BlackBody(temperature=6050)
    spbb = bb.spectral_irradiance(wavelength)
    totspbb = (spbb * dwl).sum()
    print('Total irradiance = %e W/m2' % totspbb)

    ### AM0 model
    am = irfpy.util.solarspectra.AM0()
    spam = am.spectral_irradiance(wavelength)
    totspam = (spam * dwl).sum()
    print('Total irradiance = %e W/m2' % totspam)

    plt.figure()

    ### Plot of spectral irradiance
    plt.subplot(211)
    plt.plot(wavelength / 1e-9, spbb * 1e-9, 'b-', label='Black body 6050K (TOT=%.2e)' % totspbb)   # For converting nm and W/m2/nm
    plt.plot(wavelength / 1e-9, spam * 1e-9, 'r-', label='ASTM E490 AM0 (TOT=%.2e)' % totspam)   # For converting nm and W/m2/nm

    plt.xlabel('Wavelength [nm]')
    plt.ylabel('Spectral Irradiance [W/m^2/nm]')

    plt.legend()

    ### Plot number of photons
    plt.subplot(212)

    fphbb = bb.photon_flux(wavelength)   # in /m2 /m /s
    totfphbb = (fphbb * dwl).sum()
    print('Total flux = %e /m2 /s' % (fphbb * dwl).sum())

    fpham = am.photon_flux(wavelength)   # in /m2 /m /s
    totfpham = (fpham * dwl).sum()
    print('Total flux = %e /m2 /s' % (fpham * dwl).sum())

    plt.plot(wavelength / 1e-9, fphbb * 1e-9, 'b-', label='Black body 6050 K (TOT=%.2e)' % totfphbb)   # For converting nm and /m2/nm /s
    plt.plot(wavelength / 1e-9, fpham * 1e-9, 'r-', label='ASTM E490 AM0 (TOT=%.2e)' % totfpham)   # For converting nm and /m2/nm /s
    plt.xlabel('Wavelength [nm]')
    plt.ylabel('Photon flux [1/m^2/nm/s]')

    plt.legend()


    plt.savefig('sun_spectrum.png')


if __name__ == "__main__":
    main()