cena_visualize_fov
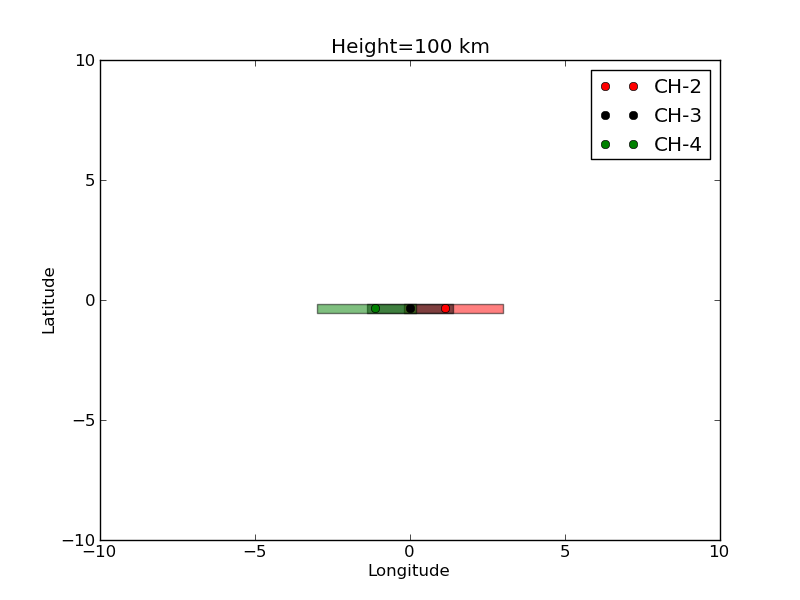
This is a script that displays the CENA FoV mapped onto the lunar surface.
The script draw the mapping of the FoV of CENA into the lunar surface.
#!/usr/bin/env python

''' This is a script that displays the CENA FoV mapped onto the lunar surface.

The script draw the mapping of the FoV of CENA into the lunar surface.

.. image:: ../../../src/scripts/cena_visualize_fov.png
'''


import math

import matplotlib as mpl
import matplotlib.pyplot as plt

import irfpy.cena.fov as fov

def map_angle_on_moon(phi, height=100.0):
    r''' Map the given angle from nadir in degrees to the lunar surface.

    .. note::

        This function would be in some module in the future.

    :param phi: The angle, :math:`\phi`, between the line of sight and the nadir in degrees.
        Centered at the spacecraft.
    :keyword height: The height of the s/c in km.
    :returns: The selenographic angle, :math:`\theta`, from the footpoint of the spacecraft.

    The mapping is a simple geometry.

    Here we denote the lunar radius :math:`R=1738` km and the height of the
    spacecraft :math:`h`.  Also denote :math:`\xi` as a distance from the spacecraft
    to the projection point.  From simple geometry, you can know

    .. math::

        R\sin\theta = \xi\sin\phi
        (R+h)\sin\theta = \xi\sin(\theta+\phi)

    Removing :math:`\xi` from these two equations leads a simple formulation of

    .. math::

        \theta = \arcsin(\frac{R+h}{R}\sin\phi) - \phi
    '''

    rmoon = 1738.
    radphi = phi * math.pi / 180.
    inasin = (rmoon + height) * math.sin(radphi) / rmoon

    try:
        radasin = math.asin(inasin)
        degasin = radasin * 180. / math.pi
    except ValueError:
        return float('nan')

    return degasin - phi


if __name__ == '__main__':

    # Define the spacecraft height.
    h = 100.

    # First, calculate the FoVs and their FWHMs.

    azim_center = [fov.azim_pix_center(i) for i in range(7)]
    azim_fwhm = [fov.azim_pix_fwhm(i) for i in range(7)]

    # In the elevation direction
    elev_center = [fov.elev_pix_center(i) for i in range(7)]
    elev_fwhm = [fov.elev_pix_fwhm(i) for i in range(7)]

    # Prepare the canbus
    fig = plt.figure()
    ax = fig.add_subplot(111)


    # For CH-2 to 4

    colors = [None, 'b', 'r', 'k', 'g', 'm', None]
    for ch in range(2, 5):
        t0 = azim_center[ch] - azim_fwhm[ch] / 2.0
        t1 = azim_center[ch] + azim_fwhm[ch] / 2.0
        p0 = elev_center[ch] - elev_fwhm[ch] / 2.0
        p1 = elev_center[ch] + elev_fwhm[ch] / 2.0

        t0m = map_angle_on_moon(t0, height=h)
        t1m = map_angle_on_moon(t1, height=h)
        p0m = map_angle_on_moon(p0, height=h)
        p1m = map_angle_on_moon(p1, height=h)

        tc = map_angle_on_moon(azim_center[ch])
        pc = map_angle_on_moon(elev_center[ch])

        print('CH-', ch, tc, pc, "/", t0m, t1m, p0m, p1m)

        rec = mpl.patches.Rectangle((t0m, p0m), t1m - t0m, p1m - p0m,
                    alpha=0.5, fc=colors[ch])

        ax.add_patch(rec)

        ax.plot([tc], [pc], colors[ch] + 'o', label='CH-%01d' % ch)

    ax.set_xlim(-10, 10)
    ax.set_ylim(-10, 10)

    ax.legend()
    ax.set_title('Height=%g km' % h)
    ax.set_xlabel('Longitude')
    ax.set_ylabel('Latitude')

    fig.savefig(__file__[:-3] + '.png')