How to plot a moon map
Plotting functionalities are implemented in pyana.*.plot module.
A simple example of plotting the moon map is
>>> from pyana.cy1.plot import axis_cy1_me
>>> axis_cy1_me.axis_map_me()
You will see a Moon map.
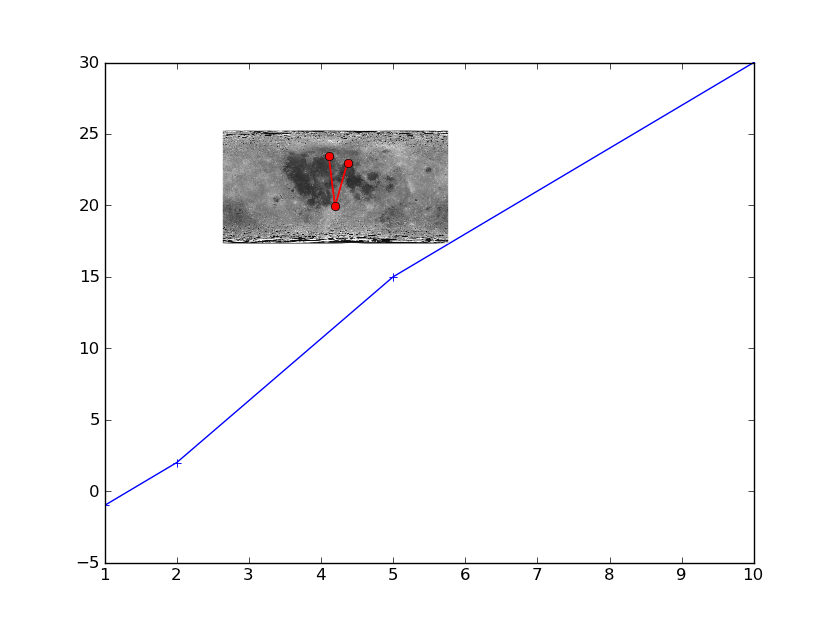
Another example to plot a map overlayed over some another plot.
# First plot
>>> import matplotlib.pyplot as plt
>>> fig = plt.figure()
>>> axmain = fig.add_subplot(111)
>>> axmain.plot([1, 2, 5, 10], [-1, 2, 15, 30], 'b-+')

# Overlayed
>>> from pyana.cy1orb.plot import axis_cy1_me
>>> axmap, immap = axis_cy1_me(rect=[0.2, 0.6, 0.4, 0.2])
>>> axmap.plot([-10, 0, 20], [50, -30, 40], 'r-o')

# Just for saving
>>> fig.savefig('moon_map_on_plot.png')
The resulting figure looks like: