Draw a moon map
Simple drawing
Low-resolution data file is accompanied with irfpy.planets package.
>>> import matplotlib.pyplot as plt
>>> from irfpy.moon import moon_map
>>> map = moon_map.MoonMapSmall()
>>> plt.imshow(map.image)
Getting data as value
Low-resolution data file is accompanied with irfpy.planets package.
>>> from irfpy.moon import moon_map
>>> map = moon_map.MoonMapSmall()
>>> pixel_data = map.image
>>> print(pixel_data.shape)
(512, 1024, 3)
Note that (as in rather many image handling application) the order
of the pixel data is for (y, x, color) and the index is from top-left.
Also note that color has 3 values (RGB), but as the source file is
a w/b, all the values are the same.
>>> print(pixel_data[30, 50])
[55 55 55]
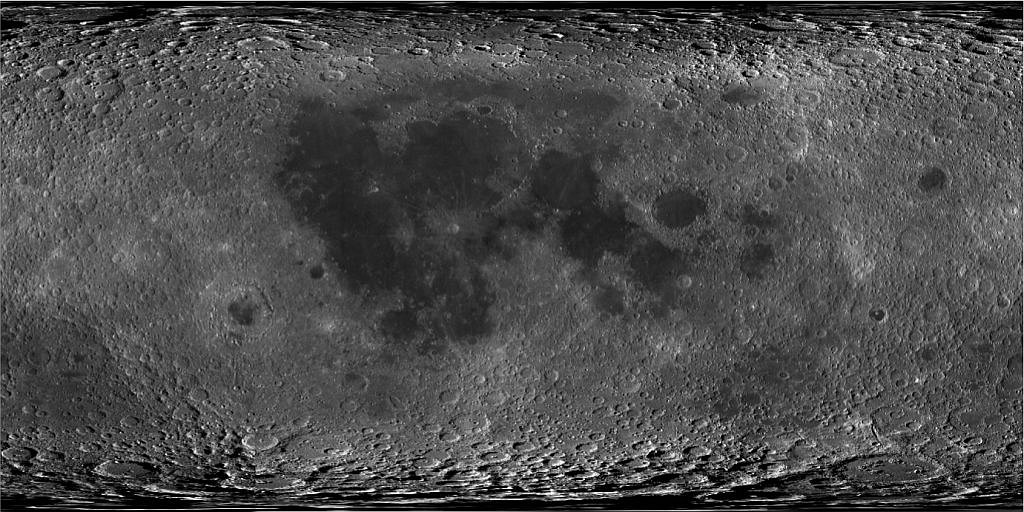
of course you can plot the map using imshow function.
>>> import matplotlib.pylot as plt
>>> plt.imshow(pixel_data, cmap='gray')
>>> plt.savefig('tutorial_moonmap_01.png')
The coordinates used in pixel_data is 90 to -90 for latitude, and -180 to 180 for longitude.
To handle the coordinates, it may be good idea to use irfpy.util.gridsphere.SimpleGridSphere object
as shown in the next section.
Getting data as SimpleGridSphere object
Data on a map is handled using irfpy.util.gridsphere.SimpleGridSphere class.
It supports longitude-latitude conversion, pixel numbering, and so on.
>>> from irfpy.moon import moon_map
>>> map = moon_map.MoonMapSmall()
>>> map_on_sphere = map.gridsphere()
>>> print(map_on_sphere)
SimpleGridSphere nLon=1024, nLat=512, nData=524288.
Then, it is easier to plot by pcolor or pcolormesh.
>>> blon, blat = map_on_sphere.get_bgrid(delta=0.01)    # Grid specifying the longitude and latitude.
>>> level = map_on_sphere.get_average()
>>> plt.pcolor(blon, blat, level)
>>> plt.savefig('tutorial_moonmap_02.png')
Note the order of indexes for the level: Its shape is (nlat=512, nlon=1024).
the bound grid has the shape of (nlat+1, nlon+1)=(513, 1025).
Plot using basemap
Basemap (https://matplotlib.org/basemap/) is an add-on to matplotlib, and can be installed by the following command.
conda install -c conda-forge basemap
Warning
it is not recommended to install as follows (as of 2018-09-21):
conda install basemap
this installs old version, so that the numpy package will be downgreaded.
The basemap can handle many mapping projections to onto a (terrestrial) globe.
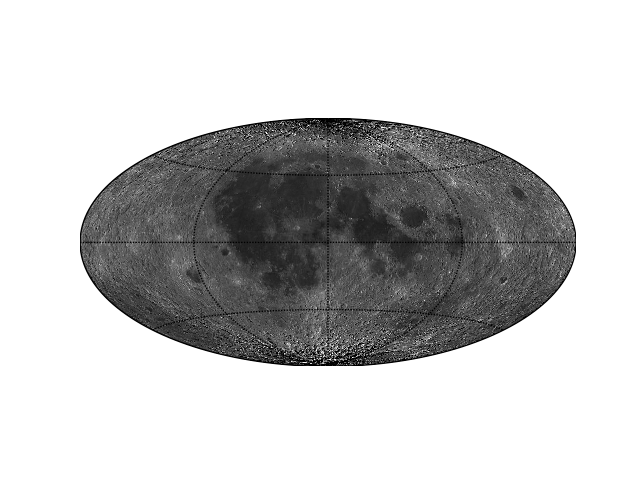
Example: Hammer projection
See also https://matplotlib.org/basemap/users/hammer.html for Hammer projection.
# set up the Basemap
from mpl_toolkits.basemap import Basemap
m = basemap(projection='hammer', lon_0=0)
m.drawparallels([-45, 0, 45])
m.drawmeridians([-90, 0, 90])

# prepare the map
from irfpy.moon import moon_map
map = moon_map.MoonMapSmall()
map_on_sphere = map.gridsphere()
blon, blat = map_on_sphere.get_bgrid()
level = map_on_sphere.get_average()

# pcolor on the map
m.pcolormesh(blon, blat, level, latlon=True, cmap='gray')

# save
import matplotlib.pyplot as plt
plt.savefig('tutorial_moonmap_03.png')
Example 2: South pole region
See also https://matplotlib.org/basemap/users/plaea.html
# set up the Basemap
from mpl_toolkits.basemap import Basemap
m = Basemap(projection='splaea', boundinglat=-70, lon_0=90)
m.drawparallels([-60, -70, -80], color='w')
m.drawmeridians([-135, -90, -45, 0, 45, 90, 135, 180], color='w')

# Prepare the map
from irfpy.moon import moon_map
map = moon_map.MoonMapSmall()
map_on_sphere = map.gridsphere()
blon, blat = map_on_sphere.get_bgrid(delta=0.01)
level = map_on_sphere.get_average()

# Pcolor on the map
m.pcolormesh(blon, blat, level, latlon=True, cmap='gray')

# Save
import matplotlib.pyplot as plt
plt.savefig('tutorial_moonmap_04.png')
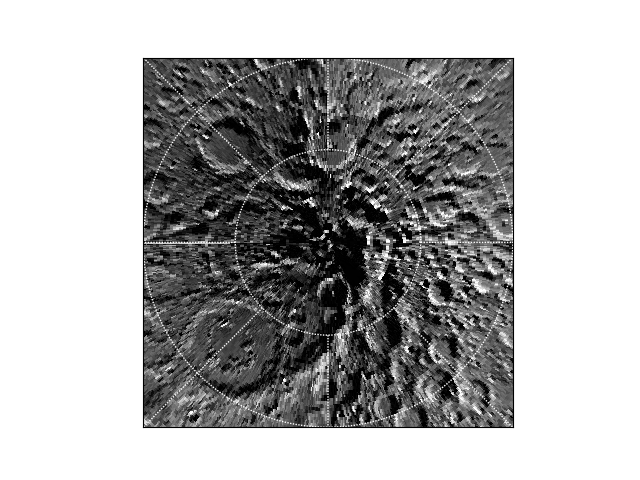
A tip is to use delta option for the map_on_sphere object.
Otherwise, the pcolormesh cannot handle the periodic condition of longitude and/or the anomalous point at the pole.
Example 3: Plot some masked data on the South pole
Plot some data on a map.
# Set up the data.
from irfpy.util import gridsphere
data = gridsphere.SimpleGridSphere(nlon=36, nlat=18)   # Longitude-latitude histogram system
data.append_value_lonlat(30, -73, 300)   # Data value is added to the longitude=30, latitude=70.
data.append_value_lonlat(80, -78, 200)
data.append_value_lonlat(230, -83, 400)
data.append_value_lonlat(310, -88, 800)
data_map = data.get_average()
data_blon, data_blat = data.get_bgrid(delta=0.01)

# Set up the Basemap
from mpl_toolkits.basemap import Basemap
m = Basemap(projection='splaea', boundinglat=-70, lon_0=90)
m.drawparallels([-60, -70, -80], color='w')
m.drawmeridians([-135, -90, -45, 0, 45, 90, 135, 180], color='w')

# Prepare the map
from irfpy.moon import moon_map
map = moon_map.MoonMapSmall()
map_on_sphere = map.gridsphere()
blon, blat = map_on_sphere.get_bgrid(delta=0.01)
level = map_on_sphere.get_average()

# Draw the map
m.pcolormesh(blon, blat, level, latlon=True, cmap='gray')

# Draw the data
m.pcolormesh(data_blon, data_blat, data_map, latlon=True, cmap='plasma')

# Draw the colorbar
import matplotlib.pyplot as plt
plt.colorbar()

# Save
import matplotlib.pyplot as plt
plt.savefig('tutorial_moonmap_05.png')