snippet_mars.exosphere_max
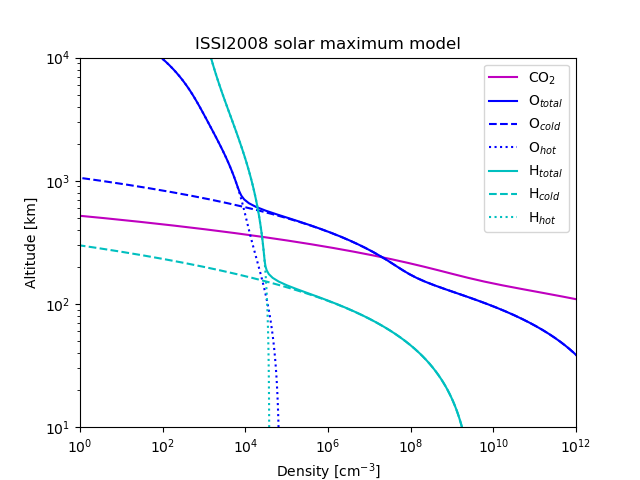
A sample to plot Martian exosphere density profile for solar max.
The densities of the Martian exosphere are implemented in the module irfpy.mars.exosphere.
""" A sample to plot Martian exosphere density profile for solar max.

The densities of the Martian exosphere are implemented in the module :mod:`irfpy.mars.exosphere`.

.. image:: ../../../src/scripts/snippet_mars/ISSI2008_solmax.png
"""

import numpy as np
import matplotlib.pyplot as plt
from irfpy.mars.exosphere import ISSI2008_SolarMax as exosph_max


def main():
    heights = np.logspace(1, 4, 100)    # Heights from 10 km to 10000 km with 100 data points

    # CO2 density
    co2 = exosph_max.CO2(heights)

    # O density
    o_cold = exosph_max.O_cold(heights)
    o_hot = exosph_max.O_hot(heights)
    o_tot = o_cold + o_hot

    # H denisty
    h_cold = exosph_max.H_cold(heights)
    h_hot = exosph_max.H_hot(heights)
    h_tot = h_cold + h_hot


    # Plot
    plt.subplot(111, xscale='log', yscale='log',
                xlim=[1e0, 1e12], ylim=[1e1, 1e4],
                xlabel='Density [cm$^{-3}$]', ylabel='Altitude [km]',
                title='ISSI2008 solar maximum model')

    plt.plot(co2, heights, color='m', label='CO$_2$')
    plt.plot(o_tot, heights, color='b', label='O$_{total}$')
    plt.plot(o_cold, heights, color='b', ls='dashed', label='O$_{cold}$')
    plt.plot(o_hot, heights, color='b', ls='dotted', label='O$_{hot}$')
    plt.plot(h_tot, heights, color='c', label='H$_{total}$')
    plt.plot(h_cold, heights, color='c', ls='dashed', label='H$_{cold}$')
    plt.plot(h_hot, heights, color='c', ls='dotted', label='H$_{hot}$')

    plt.legend()

    plt.savefig('ISSI2008_solmax.png')


if __name__ == "__main__":
    main()