plot_moon_anomaly_gerasimovic
An example to plot lunar magnetic anomaly.
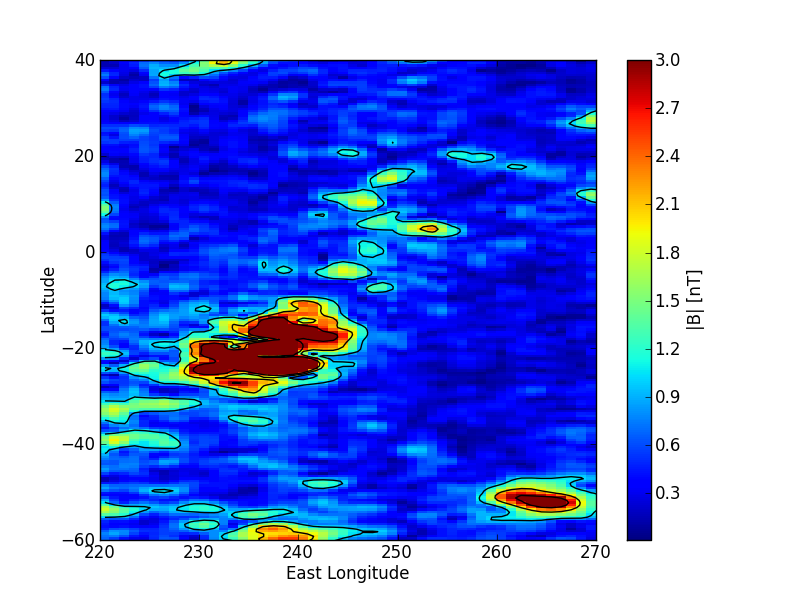
''' An example to plot lunar magnetic anomaly.

.. image:: ../../../src/scripts/plot_moon_anomaly_gerasimovic.png
'''

import os
import sys
import logging
logging.basicConfig()
import datetime
import math

import matplotlib.pyplot as plt
import numpy as np
import scipy as sp

from irfpy.moon.anomaly import AnomalyModelPME as LunarAnomaly

def main():

    anom = LunarAnomaly()

    lon, lat, btot = anom.lon, anom.lat, anom.b

    # Select only longitude 220 to 270 (index same) and latitude -60 to 40 (300 to 100)
    lon = lon[220:271, 100:301]
    lat = lat[220:271, 100:301]
    btot = btot[220:271, 100:301]

    fig = plt.figure()
    ax = fig.add_subplot(111)
    img = ax.pcolor(lon, lat, btot, vmax=3)
    cnt = ax.contour(lon + 0.5, lat - 0.25, btot, colors='k', levels=[1, 2, 3])

    ax.set_xlim(220, 270)
    ax.set_ylim(-60, 40)
    ax.set_xlabel('East Longitude')
    ax.set_ylabel('Latitude')

    cb = fig.colorbar(img)
    cb.set_label('|B| [nT]')

    fig.savefig('plot_moon_anomaly_gerasimovic.png')

if __name__ == '__main__':

    main()