Get the Venus plasma boundary positions
Here we will get the plasma boundaries the bow shock and induced magnetosphere boundaries (sometimes call also as magnetic pileup boundary or ion composition boundaries).
Author: Yoshifumi Futaana
Model from Venus Express, solar minimum
The model is based on Martinecz et al., 2008. (doi: 10.1016/j.pss.2007.07.007)
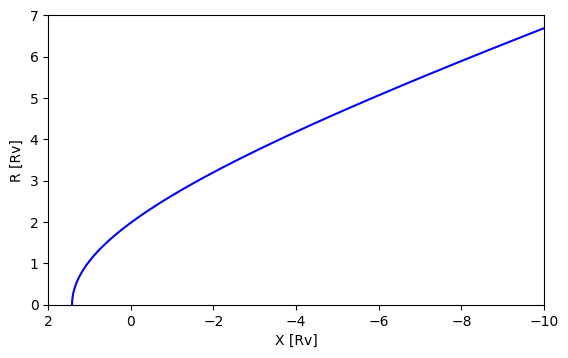
irfpy implementation to get the bow shock position
irfpy provides a function to get the boundary surface position.
https://irfpy.irf.se/projects/planets/api/api_irfpy.venus.bowshock.html
[1]:
from irfpy.venus import bowshock
[2]:
x_bs, r_bs = bowshock.xr_martinecz08()
x_bs and r_bs are numpy arrays that give the position of the bow shock in Rv.
[3]:
import matplotlib.pyplot as plt
[4]:
plt.plot(x_bs, r_bs, 'b')   # Plot the data in the cylindrical coordinate

# Figure decoration.
plt.xlim(2, -10)
plt.ylim(0, 7)
plt.xlabel('X [Rv]')
plt.ylabel('R [Rv]')
plt.gca().set_aspect(1)

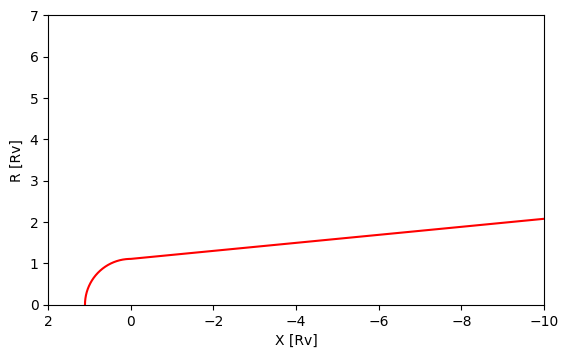
irfpy implementation to get the IMB (ICB) position
https://irfpy.irf.se/projects/planets/api/api_irfpy.venus.icb.html
It is the same interface to get the bow shock position.
[5]:
from irfpy.venus import icb
/home/jenkins/jenkins-agent/workspace/irfpy/planets/src/irfpy/venus/icb.py:17: SyntaxWarning: invalid escape sequence '\s'
  """ Return the (x,r) coordinates of Martinecz 08 model.
[6]:
x_icb, r_icb = icb.xr_martinecz08()
[7]:
plt.plot(x_icb, r_icb, 'r')   # Plot the data in the cylindrical coordinate

# Figure decoration.
plt.xlim(2, -10)
plt.ylim(0, 7)
plt.xlabel('X [Rv]')
plt.ylabel('R [Rv]')
plt.gca().set_aspect(1)

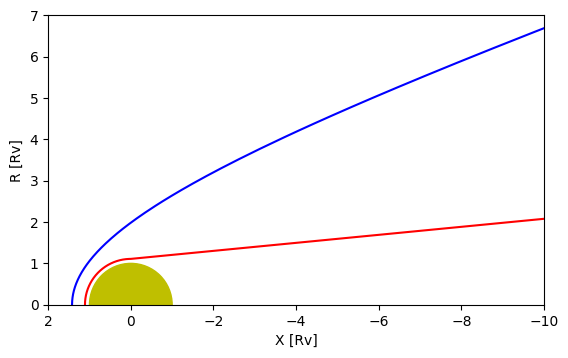
Final plot
Here is the final plot
[8]:
from matplotlib.patches import Circle # Circle to represent Venus
[9]:
plt.plot(x_bs, r_bs, 'b')   # Plot the BS data in the cylindrical coordinate
plt.plot(x_icb, r_icb, 'r')   # Plot the ICB data in the cylindrical coordinate

# Figure decoration.
plt.gca().add_patch(Circle([0, 0], 1, color='y'))   # Add venus disk

plt.xlim(2, -10)
plt.ylim(0, 7)
plt.xlabel('X [Rv]')
plt.ylabel('R [Rv]')
plt.gca().set_aspect(1)

[ ]: