How to get IMA data
There are several ways of handling IMA count data. It really depends on the users and their purposes.
irfpy.aspera aims to handle a significant part of user cases.
In this tutorial, we go through the following examples.
Get 3D data at a specific time
Access using data center
To get the 3D matrix (192s data), you may use the DataCenterCount3d data center.
>>> import datetime
>>> from irfpy.vima import rawdata
>>> dc = rawdata.DataCenterCount3d()
>>> tstart, data = dc.nearest(datetime.datetime(2007, 10, 10, 1, 30))
The returned tstart is the actual start time of the 3D data containing the given time.
>>> print(tstart)
2007-10-10 01:30:28.591000
The returned data includes the VEX/IMA 3D data.
>>> print(data)
<<class 'irfpy.imacommon.imascipac.CntMatrix'>(VEX/IMA)@2007-10-10T01:30:28.591000:MOD=24 >>25<<:CNTmax=11>
data is an object of the class irfpy.imacommon.imascipac.CntMatrix.
data contains more information than the count, but anyway, the data.matrix is the matrix.
>>> print(data.matrix)   # A numpy array is displayed.
>>> print(data.matrix.shape)
(32, 16, 96, 16)
Indeed, the mode 25 gives the data (32, 16, 96, 8) shape (polar angle is integrated). This is emulated to be the mode 24, with the shape of (32, 16, 96, 16).
Obsolete way
To get the 3D matrix (192s data), you may just use the following syntax.
>>> import datetime
>>> from irfpy.vima import scidata_util as vima_util
>>> tstart, data = vima_util.get3d(datetime.datetime(2007, 10, 10, 1, 30))
The returned tstart is the actual start time of the 3D data containing the given time.
>>> print(tstart)
2007-10-10 01:27:16.622219
The returned data includes the VEX/IMA 3D data.
>>> print(data)
<<class 'irfpy.imacommon.imascipac.CntMatrix'>(VEX/IMA)@2007-10-10T01:27:16.622219:MOD=25 >>25<<:CNTmax=17>
data is an object of the class irfpy.imacommon.imascipac.CntMatrix.
data contains more information than the count, but anyway, the data.matrix is the matrix.
>>> print(data.matrix)
>>> print(data.matrix.shape)
(32, 16, 96, 8)
This is (32, 16, 96, 8) shaped array. As you see, the polar angle is only 8, instead of 16. This is because the data of this time is re-binned in the polar direction.
Note
The returned data is obtained at the time “measured at the latest but before the given time”. It means that, in the above example, the given time is at 01:30:00, but the returned time is 01:27:16. It is before the given time, but the next data should be 01:30:28, which is later than the given time. This feature is intended, because only the data (starting) at 01:27:16 contains measurement at the given time 01:30:00.
On the other hand, this feature may result in a bit confusion, when the user gives the time at data gap. For example, at 2007-10-25T12:00:00, VEX/IMA was OFF.
>>> t1 = datetime.datetime(2007, 10, 25, 12, 0, 0)
>>> t2, data2 = vima_util.get3d(t1)
>>> print(t2)
2007-10-25 02:45:24
The returned time is by far earlier than the given time.
It is user’s responsibility to check if the returned data is reasonable to use for user’s purpose.
Usually, users should use the returned time tag (t2 in this case) not the given time (t1).
Exercise 1
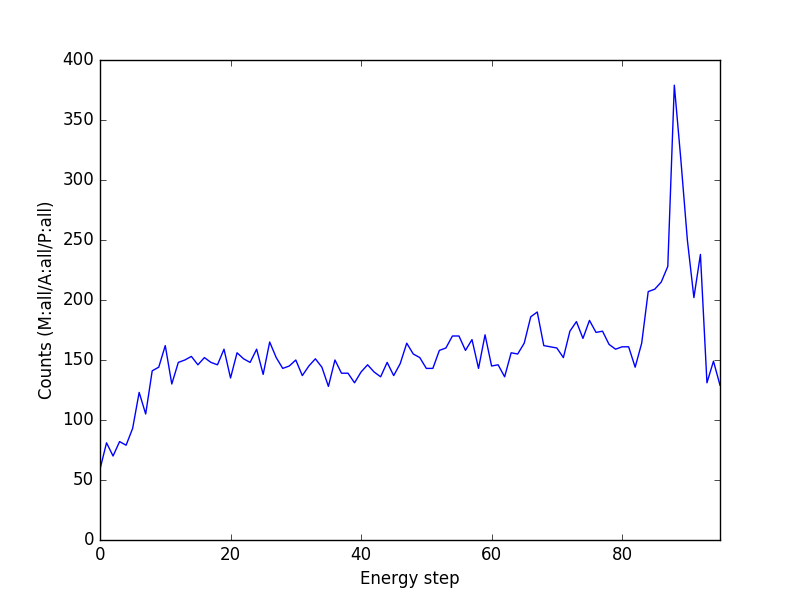
Can you then obtain the energy spectra of the above data by collapsing the data
in the mass, polar, and azimuthal angles?
Can you plot the data?
Exercise 2
Can you try to get the MEX/IMA 3D data at the 2007-10-08T08:20:00? Then can you try to get the following information?
What is the start time of the observation?
What is the binning parameter?
What is the maximum counts in the matrix?
Can you also plot the energy spectra as in Exercise 1?
Get 3D data for a given time span
To get the time series of the matrix, you may use the following flow.
>>> import datetime
>>> from irfpy.mima import rawdata
>>> dc = rawdata.DataCenterCount3d()
>>> tlist, dlist = dc.get_array(datetime.datetime(2007, 10, 9, 14, 30),
...                             datetime.datetime(2007, 10, 9, 15, 30))
Here tlist is a list of the time, and dlist is a list of data (3D spectra).
How many are 3D spectra included? You can see it by
>>> print(len(tlist))
19
Yes, 19 matrixes are there.
What are the times observed?
You can get a list of time from getobstime method.
>>> print(tlist)
[datetime.datetime(2007, 10, 9, 14, 31, 23, 771440),
 datetime.datetime(2007, 10, 9, 14, 34, 35, 865180),
 datetime.datetime(2007, 10, 9, 14, 37, 47, 833940),
 ...
 datetime.datetime(2007, 10, 9, 15, 29, 0, 240160)]
What are the 4th data of this time range?
>>> print(tlist[4])
datetime.datetime(2007, 10, 9, 14, 44, 11, 896432)
>>> print(dlist[4])
<<class 'irfpy.imacommon.imascipac.CntMatrix'>(MEX/IMA)@2007-10-09T14:44:11.896440:MOD=24 >>24<<:CNTmax=38>
What you get is the CntMatrix object that contains the data (as in Get 3D data at a specific time).
>>> print(dlist[4].matrix)
What are the matrix at 2007-10-09T15:00:00?
In addition to getting the data as array, iterator is also supported.
>>> for t0, count_matrix in dc.iter(datetime.datetime(2007, 10, 9, 14, 30),
...                                 datetime.datetime(2007, 10, 9, 15, 30)):
...     print(t0, count_matrix)
2007-10-09 14:31:23.771440 <<class 'irfpy.imacommon.imascipac.CntMatrix'>(MEX/IMA)@2007-10-09T14:31:23.771440:MOD=24 >>24<<:CNTmax=48>
2007-10-09 14:34:35.865180 <<class 'irfpy.imacommon.imascipac.CntMatrix'>(MEX/IMA)@2007-10-09T14:34:35.865180:MOD=24 >>24<<:CNTmax=88>
2007-10-09 14:37:47.833940 <<class 'irfpy.imacommon.imascipac.CntMatrix'>(MEX/IMA)@2007-10-09T14:37:47.833940:MOD=24 >>24<<:CNTmax=64>
...
2007-10-09 15:25:48.271420 <<class 'irfpy.imacommon.imascipac.CntMatrix'>(MEX/IMA)@2007-10-09T15:25:48.271420:MOD=24 >>24<<:CNTmax=2>
2007-10-09 15:29:00.240160 <<class 'irfpy.imacommon.imascipac.CntMatrix'>(MEX/IMA)@2007-10-09T15:29:00.240160:MOD=24 >>24<<:CNTmax=4>
Get 3D data for a given time span (alternative)
To get the time series of the matrix, you may use the following syntax.
>>> import datetime
>>> from irfpy.mima import scidata_util as mima_util
>>> timeser = mima_util.getarray3d(datetime.datetime(2007, 10, 9, 14, 30),
...                                datetime.datetime(2007, 10, 9, 15, 30))
>>> print(timeser)
<TimeSeriesCntMatrix:len=20 from 2007-10-09 14:29:59.802693 to 2007-10-09 15:29:00.240158>
The timeser contains a time series of IMA 3D data.
How many are 3D spectra included? You can see it by
>>> print(len(timeser))
20
Yes, 20 matrixes are there.
What are the time observed?
You can get a list of time from getobstime method.
>>> print(timeser.getobstime())
[datetime.datetime(2007, 10, 9, 14, 29, 59, 802693), datetime.datetime(2007, 10, 9, 14, 31, 23, 771439), datetime.datetime(2007, 10, 9, 14, 34, 35, 865187), datetime.datetime(2007, 10, 9, 14, 37, 47, 833940), datetime.datetime(2007, 10, 9, 14, 40, 59, 927688), datetime.datetime(2007, 10, 9, 14, 44, 11, 896432), datetime.datetime(2007, 10, 9, 14, 47, 23, 958938), datetime.datetime(2007, 10, 9, 14, 50, 35, 958933), datetime.datetime(2007, 10, 9, 14, 53, 47, 990179), datetime.datetime(2007, 10, 9, 14, 56, 59, 958932), datetime.datetime(2007, 10, 9, 15, 0, 12, 52680), datetime.datetime(2007, 10, 9, 15, 3, 24, 21424), datetime.datetime(2007, 10, 9, 15, 6, 36, 115171), datetime.datetime(2007, 10, 9, 15, 9, 48, 83925), datetime.datetime(2007, 10, 9, 15, 13, 0, 177673), datetime.datetime(2007, 10, 9, 15, 16, 12, 146416), datetime.datetime(2007, 10, 9, 15, 19, 24, 208913), datetime.datetime(2007, 10, 9, 15, 22, 36, 177667), datetime.datetime(2007, 10, 9, 15, 25, 48, 271415), datetime.datetime(2007, 10, 9, 15, 29, 0, 240158)]
What are the 5th data of this time range?
>>> print(timeser[5])
(datetime.datetime(2007, 10, 9, 14, 44, 11, 896432), <irfpy.imacommon.imascipac.CntMatrix object at 0x112b39fd0>)
What you get is the exact start time and the CntMatrix object that contains the data (as in Get 3D data at a specific time).
>>> print(timeser[5][1].matrix)
What are the matrix at 2007-10-09T15:00:00?
>>> print(timeser.get(datetime.datetime(2007, 10, 9, 15, 0, 0)))
(datetime.datetime(2007, 10, 9, 14, 56, 59, 958932), <irfpy.imacommon.imascipac.CntMatrix object at 0x112b39e10>)
Iterator is also supported.
>>> for t0, count_matrix in timeser:
...     print(t0, count_matrix)
2007-10-09 14:29:59.802693 <<class 'irfpy.imacommon.imascipac.CntMatrix'>(MEX/IMA)@2007-10-09T14:29:59.802693:MOD=24 >>24<<:CNTmax=72>
2007-10-09 14:31:23.771439 <<class 'irfpy.imacommon.imascipac.CntMatrix'>(MEX/IMA)@2007-10-09T14:31:23.771439:MOD=24 >>24<<:CNTmax=48>
2007-10-09 14:34:35.865187 <<class 'irfpy.imacommon.imascipac.CntMatrix'>(MEX/IMA)@2007-10-09T14:34:35.865187:MOD=24 >>24<<:CNTmax=88>
...
2007-10-09 15:25:48.271415 <<class 'irfpy.imacommon.imascipac.CntMatrix'>(MEX/IMA)@2007-10-09T15:25:48.271415:MOD=24 >>24<<:CNTmax=2>
2007-10-09 15:29:00.240158 <<class 'irfpy.imacommon.imascipac.CntMatrix'>(MEX/IMA)@2007-10-09T15:29:00.240158:MOD=24 >>24<<:CNTmax=3>
Note on the first and last data
The first data sometimes constitute of the data obtained by far outside of the given time. See the note in the previous section.
The first and last data is frequently constitute of a “partial” data. It is a “masked array” implemented in numpy.
>>> t0, count_matrix0 = timeser[0]
>>> print(t0)
2007-10-09 14:29:59.802693
>>> print(count_matrix0.matrix[0, 0, 0, :])
[-- -- -- -- -- -- -- -- -- 0.0 0.0 0.0 0.0 0.0 0.0 0.0]
The t0 here is the time first data is measured (at the 9th data).
The matrix has masked away for the first 9 data (polar angle).
>>> tl, count_matrixl = timeser[-1]
>>> print(tl)
2007-10-09 15:29:00.240158
>>> print(count_matrixl.matrix[0, 0, 0, :])
[0.0 0.0 0.0 0.0 0.0 -- -- -- -- -- -- -- -- -- -- --]
Exercise 3
Can you plot the time series of the maximum counts in the matrix between 2007-10-10T16:00:00 and 2007-10-11T20:00:00? Both for MEX and VEX.
Get 2D data at a specific time
To get the 2D data at a specific time, the irfpy.mima.rawdata.DataCenterCount2d data center can be used. The syntax is almost the same as the 3D data retrieval.
>>> import irfpy.mima.rawdata
>>> dc = irfpy.mima.rawdata.DataCenterCount2d()
>>> tobs, dataobs = dc.nearest(datetime.datetime(2007, 10, 8, 18))
>>> print(tobs)
2007-10-08 17:59:54.990900
>>> print(dataobs)
<<class 'irfpy.imacommon.imascipac.CntMatrix2D'>(MEX/IMA)@2007-10-08T17:59:54.990900:MOD=24 >>24<<:POL=06/06:CNTmax=5>
Now let’s look at the dataobs carefully. It contains many information related to the data.
For example,
tTime in datetime object
matrixMatrix of count rate. Usually it is (M32,A16,E96).
polarTuple providing the start polar index and the stop polar index (inclusive)
modeA binning mode (
irfpy.imacommon.imamode.Mode)
See example below.
>>> print(dataobs.t)
2007-10-08 17:59:54.990900
>>> print(dataobs.polar)   # The polar angle index. In this case, index 6 only.
[6, 6]
>>> print(dataobs.mode)
<IMA:Mode-24 (Exm-0) M32/A16/E96/P16>
>>> print(dataobs.matrix)
[[[0 0 0 ..., 0 0 0]
  [0 0 0 ..., 0 0 0]
  [0 0 0 ..., 0 0 0]
  ...,
  [0 0 0 ..., 0 0 0]
  [0 0 0 ..., 0 0 0]
  [0 0 0 ..., 0 0 0]]
  ...,
  ]
>>> print(dataobs.matrix.shape)
(32, 16, 96)
Get 2D data at a specific time (obsolete)
You can get the single 2-D data using
get() method.
The obtained value is a tuple of (datetime, irfpy.imacommon.imascipac.CntMatrix2D),
as in the 3D case.
>>> import irfpy.mima.scidata_util as mima_util
>>> tobs, dataobs = mima_util.get2d(datetime.datetime(2007, 10, 8, 18))  # Data at 1 oclock.
>>> print(tobs)
2007-10-08 17:59:54.990894
>>> print(dataobs)
<<class 'irfpy.imacommon.imascipac.CntMatrix2D'>(MEX/IMA)@2007-10-08T17:59:54.990894:MOD=24 >>24<<:POL=06/06:CNTmax=5>
Now let’s look at the dataobs carefully. It contains many information related to the data.
For example,
tTime in datetime object
matrixMatrix of count rate. Shape depends on the mode, but for nominal modes it is (M32,A16,E96).
polarTuple providing the start polar index and the stop polar index (inclusive)
modeA binning mode (
irfpy.imacommon.imamode.Mode)
See example below.
>>> print(dataobs.t)
2007-10-08 17:59:54.990894
>>> print(dataobs.polar)
[6, 6]
>>> print(dataobs.mode)
<IMA:Mode-24 (Exm-0) M32/A16/E96/P16>
>>> print(dataobs.matrix)
[[[0 0 0 ..., 0 0 0]
  [0 0 0 ..., 0 0 0]
  [0 0 0 ..., 0 0 0]
  ...,
  [0 0 0 ..., 0 0 0]
  [0 0 0 ..., 0 0 0]
  [0 0 0 ..., 0 0 0]]
  ...,
  ]
>>> print(dataobs.matrix.shape)
(32, 16, 96)
Get 2D data for a given time span
Getting the data for a given time span is through two ways as 3d data center, i.e., get_array() or iter().
>>> import datetime
>>> from irfpy.vima import rawdata
>>> dc = rawdata.DataCenterCount2d()
>>> t0 = datetime.datetime(2007, 10, 18, 0, 0, 0)
>>> t1 = datetime.datetime(2007, 10, 18, 1, 0, 0)
>>> tlist, dlist = dc.get_array(t0, t1)
tlist and dlist are lists of time and data.
>>> print(tlist)
[datetime.datetime(2007, 10, 18, 0, 0, 19, 804160),
 datetime.datetime(2007, 10, 18, 0, 0, 43, 804200),
 datetime.datetime(2007, 10, 18, 0, 1, 7, 804200),
...
>>> print(dlist)
[<irfpy.imacommon.imascipac.CntMatrix2D at 0x7f9060b5c7d0>,
 <irfpy.imacommon.imascipac.CntMatrix2D at 0x7f90b7c2d2d0>,
 <irfpy.imacommon.imascipac.CntMatrix2D at 0x7f905ca69690>,
...
You may see that there are 150 2-D data. It can be taken as well by
>>> print(len(tlist))
150
>>> print(tlist[4])
2007-10-18 00:01:55.804180
>>> print(dlist[4])
<<class 'irfpy.imacommon.imascipac.CntMatrix2D'>(VEX/IMA)@2007-10-18T00:01:55.804180:MOD=25 >>25<<:POL=06/07:CNTmax=27>
>>> obsdata.matrix.shape
(32, 16, 96)
It is noted that the data is obtained in the mode two neigiboring polar bins are summed over.
Therefore, the polar is [06, 07] as below.
>>> print(obsdata.polar)
[6, 7]
You can use iteration as follows:
>>> for t, d in dc.iter(t0, t1):
...     print(t, d)    # Any processing here.
Get 2D data for a given time span (obsolele)
Use irfpy.vima.scidata_util.getarray2d() function. With time intervals as argument,
the function will return the time series of 2D data (irfpy.imacommon.imascipac.TimeSeriesCntMatrix2D.
>>> import datetime
>>> from irfpy.vima import scidata_util as vima_util
>>> t0 = datetime.datetime(2007, 10, 18, 0, 0, 0)
>>> t1 = datetime.datetime(2007, 10, 18, 1, 0, 0)
>>> dataset = vima_util.getarray2d(t0, t1)
The dataset represent the time series of VEX/IMA 2D data. Let’s look at the dataset.
>>> print(dataset)
<TimeSeriesCntMatrix2D:len=151 from 2007-10-17 23:59:55.804166 to 2007-10-18 00:59:56.335884>
You may see that there are 151 2-D data. It can be taken as well by
>>> print(len(dataset))
151
You can use the getobstime() method to get the
list of observation time.
>>> obstime = dataset.getobstime()
>>> print(obstime)
[datetime.datetime(2007, 10, 17, 23, 59, 55, 804166),
 datetime.datetime(2007, 10, 18, 0, 0, 19, 804167),
 datetime.datetime(2007, 10, 18, 0, 0, 43, 804198),
 datetime.datetime(2007, 10, 18, 0, 1, 7, 804198),
 ...]
You can get the individual data either get or [i].
>>> tobs, obsdata = dataset.get(datetime.datetime(2007, 10, 18, 0, 30))   # Data at 00:30.
>>> tobs, obsdata = dataset[5]    # 5-th data
The obsdata here is the one that can get by get2d method as explained above.
>>> print(obsdata)
<<class 'irfpy.imacommon.imascipac.CntMatrix2D'>(VEX/IMA)@2007-10-18T00:01:55.804189:MOD=25 >>25<<:POL=06/07:CNTmax=27>
>>> obsdata.matrix.shape
(32, 16, 96)
It is noted that the data is obtained in the mode two neigiboring polar bins are summed over.
Therefore, the polar is [06, 07] as below.
>>> print(obsdata.polar)
[6, 7]
Exercise 4
Can you load the 2D data between 2007-10-20T00:00:00 and 2007-10-21T00:00:00 for MEX and VEX? How many were 2D data matrix obtained?
Then, can you plot the polar index as a function of time? Compare Mars and Venus. Why do they different?