Quick look plots
Let’s see how you produce a quick look plot. From a terminal, you may type as follows.
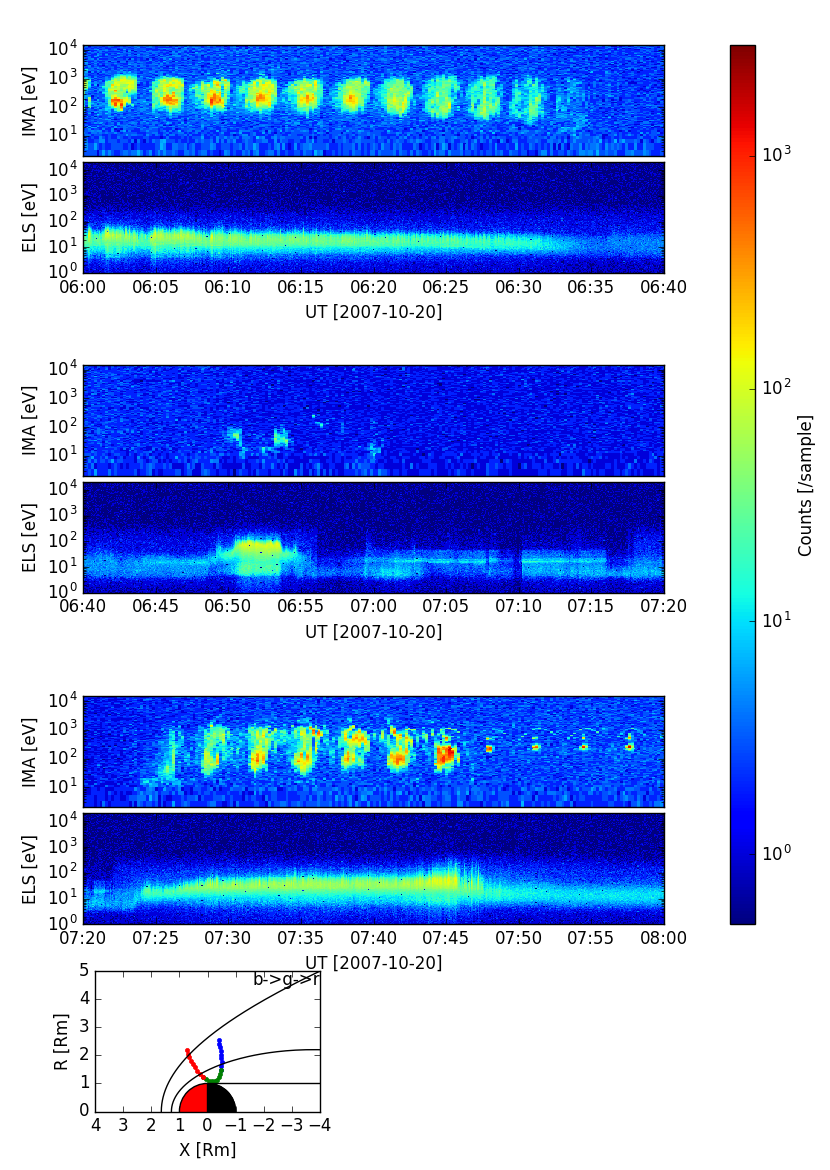
irfpy-aspera-mex-plasma 2007-10-20T06:00:00 2007-10-20T08:00:00
The specification of the time should be always in the ISO format (yyyy-mm-ddThh:mm:dd). It is recognized as UTC.
You can save the plot into a file using -o option.
irfpy-aspera-mex-plasma -o 2100_1.png 2007-10-20T06:00:00 2007-10-20T08:00:00
Exercise
Can you plot the data in the same time period as above but using different color scale? (For example, between 10 and 500.)
Can you plot the MEX/IMA data as energy-time diagram for 16 different azimuthal sectors? (Hint: try to find a relevant command line program starting from
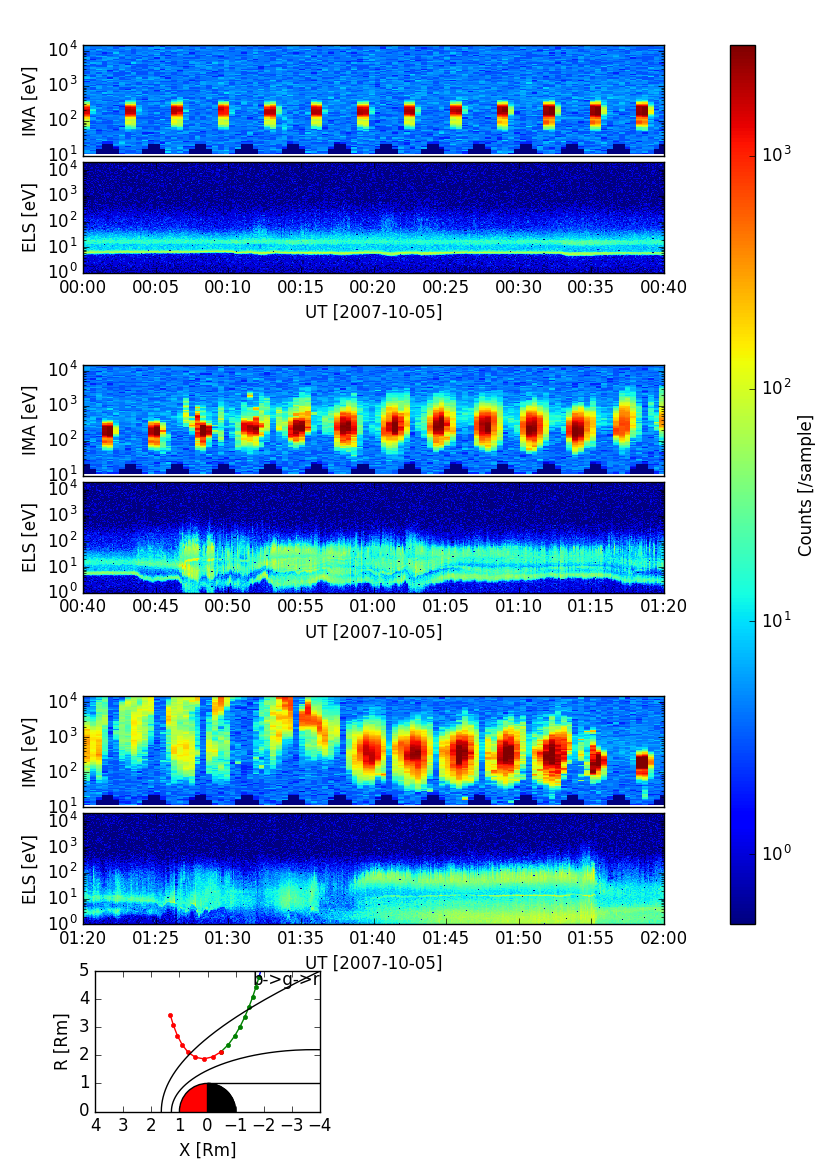
irfpy-.)Can you plot the VEX plasma data between 2007-10-05T00:00:00 and 2007-10-05T02:00:00?